Desktop clinical software · Real client delivery
DentalClinic
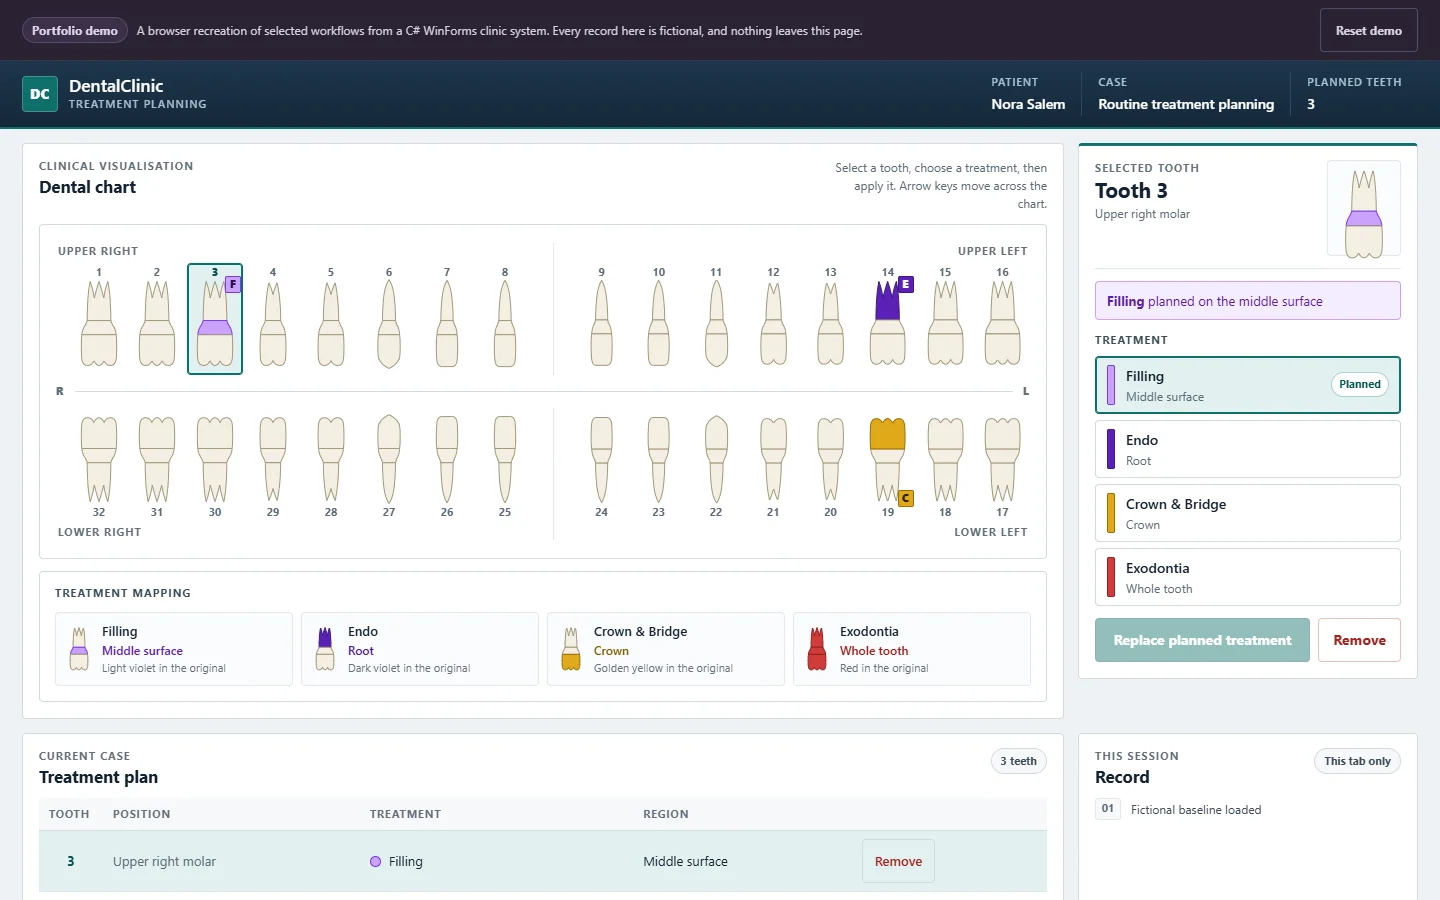
Delivered to an anonymous dental-clinic client in 2021, DentalClinic is a C# WinForms and SQL Server line-of-business system. Its defining interface translates four verified treatment categories into distinct regions on a selectable 32-tooth chart.
- C# / .NET
- SQL Server
- Clinical domain modelling
Fictional case. No database connected.
A real clinic, a real constraint
DentalClinic was delivered in 2021 for an anonymous dental-clinic client. The desktop application uses C# WinForms on .NET Framework with SQL Server and separates presentation, business logic and data access into PL, BL and DAL layers.
The central design problem was not generic record entry. Treatment planning had to preserve a clinical distinction: different treatments affect different regions of a tooth, and the interface needed to make that mapping immediate and selectable.
Mapping treatment to tooth region
Four verified mappings define the public example: Filling affects the middle surface, Endo the root, Crown & Bridge the crown, and Exodontia the whole tooth. The mapping determines which region receives the treatment state, so the visual model carries domain meaning rather than acting as decoration.
The treatment table states the relationship in text, while the interface mapping strip supplies the corresponding colour reference. Together they keep the model understandable without relying on colour alone.
Inline evidence

| Treatment | Tooth region |
|---|---|
| Filling | Middle surface |
| Endo | Root |
| Crown & Bridge | Crown |
| Exodontia | Whole tooth |
The chart as an interface
The full interface presents 32 selectable teeth with shared hover and selection behaviour. A reviewer can choose a tooth, apply a treatment to its mapped region, replace that choice or remove it, then inspect the current plan and the changes made during the session.
The chart is the project's primary visual everywhere it appears, so every crop keeps the complete upper and lower arches with their numbering legible rather than showing a fragment of the interface.
Select, apply, inspect
The sequence shows the chart overview, a selected tooth with the treatments available at that position, the applied result drawn on the mapped region, and the same chart on a narrow screen. Keeping the images in that order turns the gallery into one interaction rather than four unrelated interface captures.
Evidence gallery
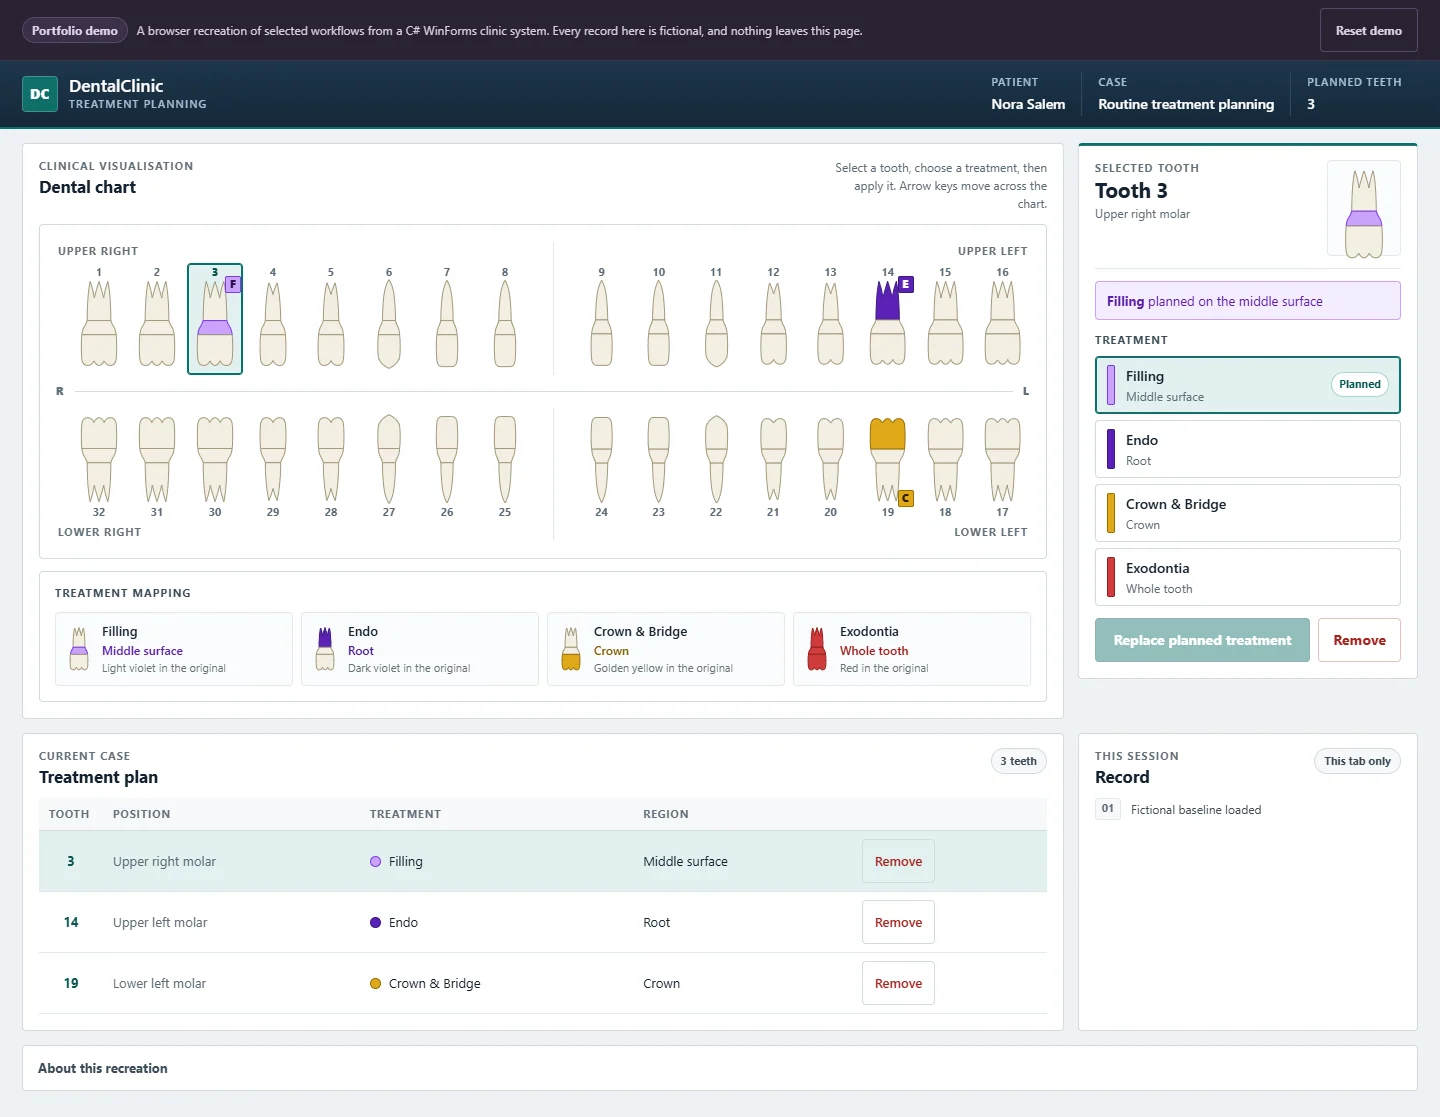
The full 32-tooth chart, the treatment mapping strip and the current plan sit on one planning surface. 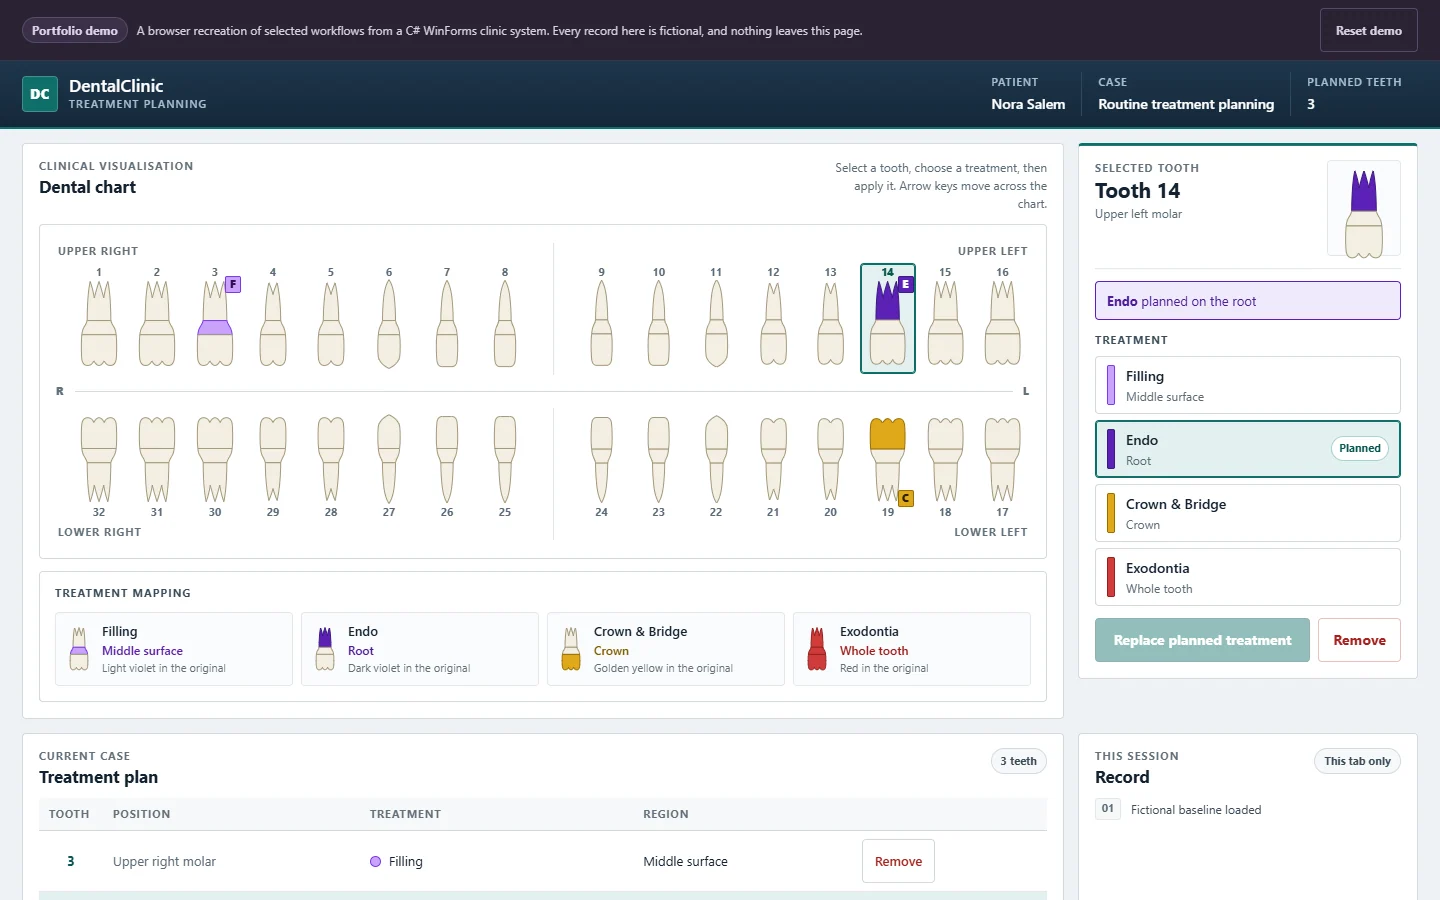
Selecting a tooth opens the treatments available for that chart position and names the region each affects. 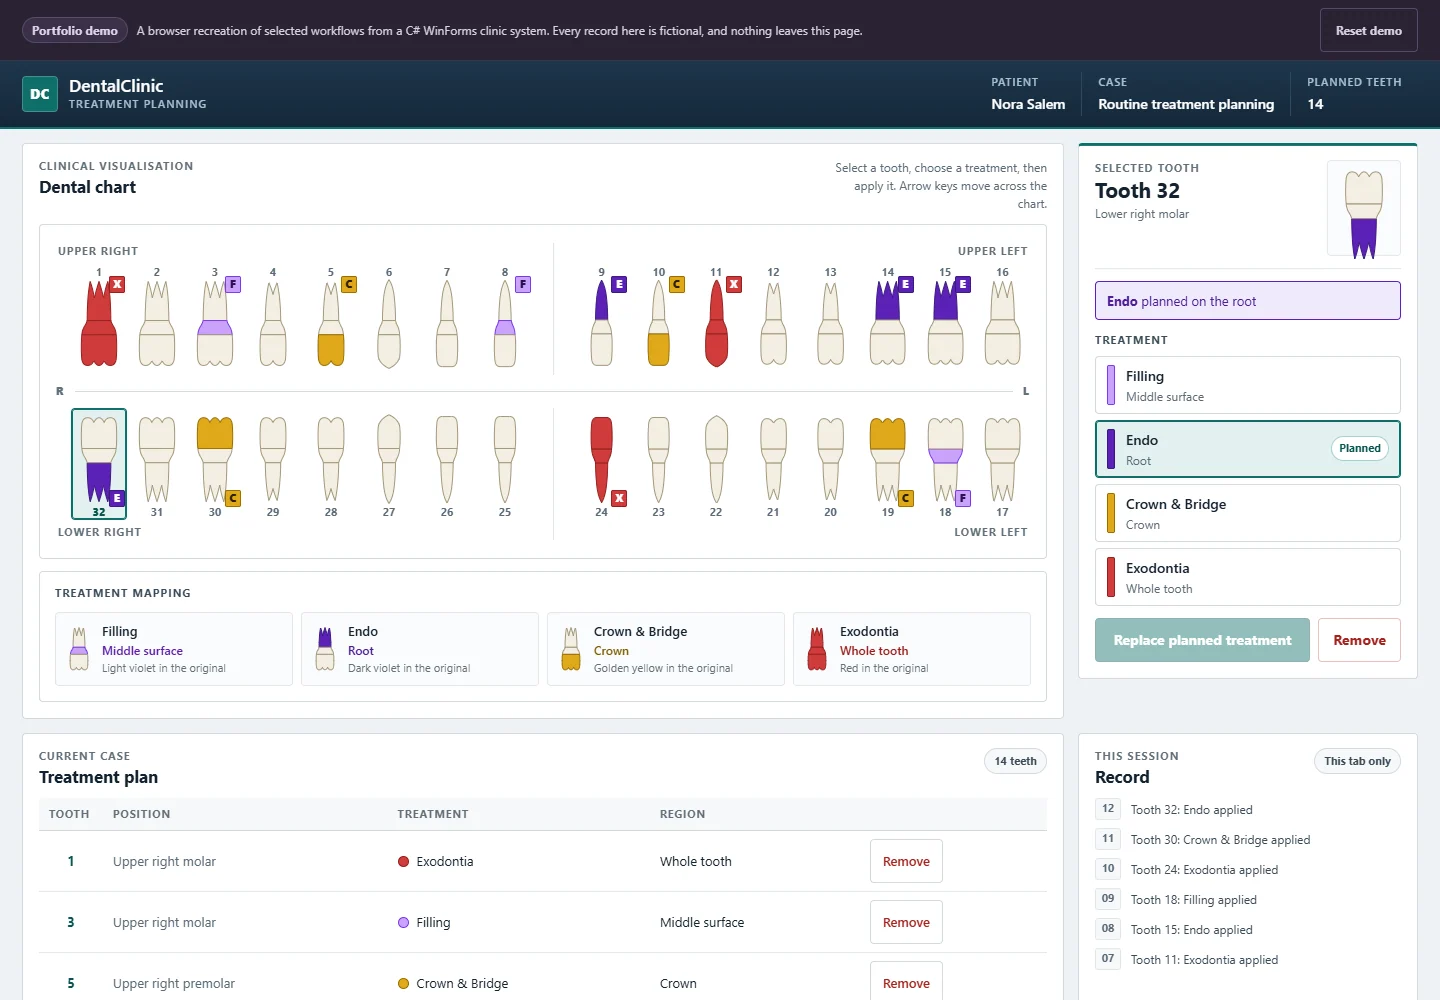
Applied treatments are drawn on the exact tooth region they affect, so the chart reads as the plan. 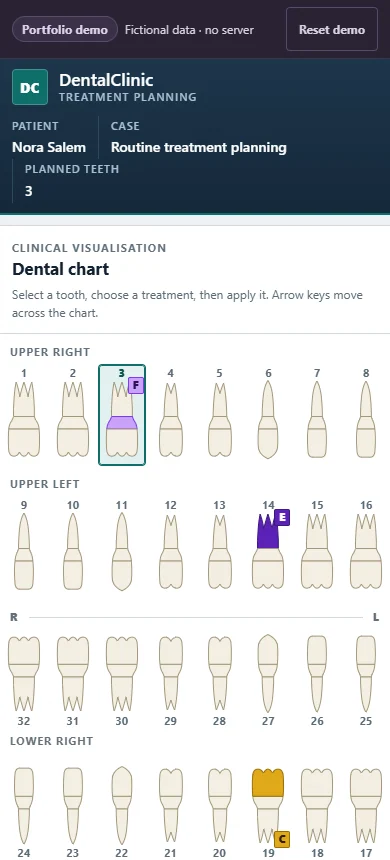
On a narrow screen the arches stack and the chart keeps its numbering rather than shrinking to illegibility.
Explore the tooth chart
The browser recreation concentrates on the treatment-planning interaction: select, apply, replace, remove and reset.
This portfolio demo recreates selected DentalClinic treatment-planning workflows using fictional data. It is fully self-contained and does not connect to the original clinic database.